Matthew Regis
Overview
This post will explore some Kusto query language (KQL) syntax through examples. If you are not familiar with KQL you can read Kusto Query Language (KQL) overview from Microsoft's documentation website. I'll be using this demo log workspace, which is free and should be available to anyone. You'll need to create an account to access it though which is also free to do.
Examples
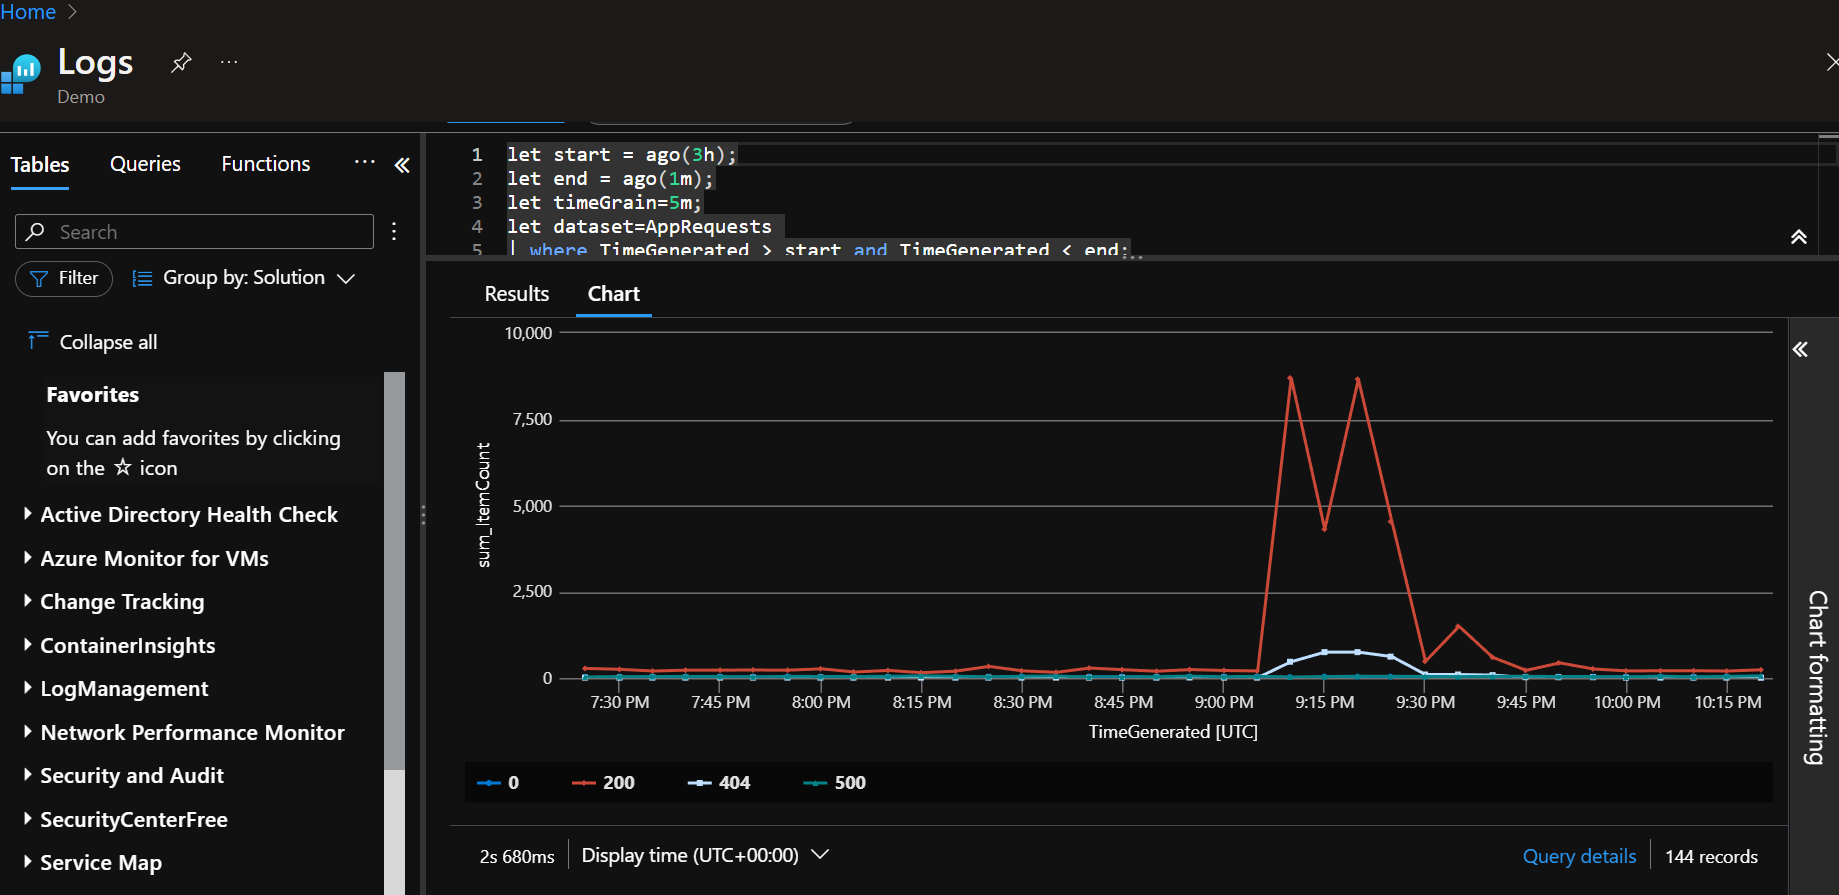
Requests by status code
This query will display requests by result code for the last 3 hours and render the results visually as a time chart. This is a useful indicator at how your server is performing.
let start = ago(3h);
let end = now();
let timeGrain=5m;
let dataset=AppRequests
| where TimeGenerated > start and TimeGenerated < end;
dataset
| summarize sum(ItemCount) by ResultCode, bin(TimeGenerated, max_of(timeGrain, 1m))
| order by TimeGenerated asc
| render timechart
In this example we can see a spike of requests around 9:05pm, which dies around 9:30pm.
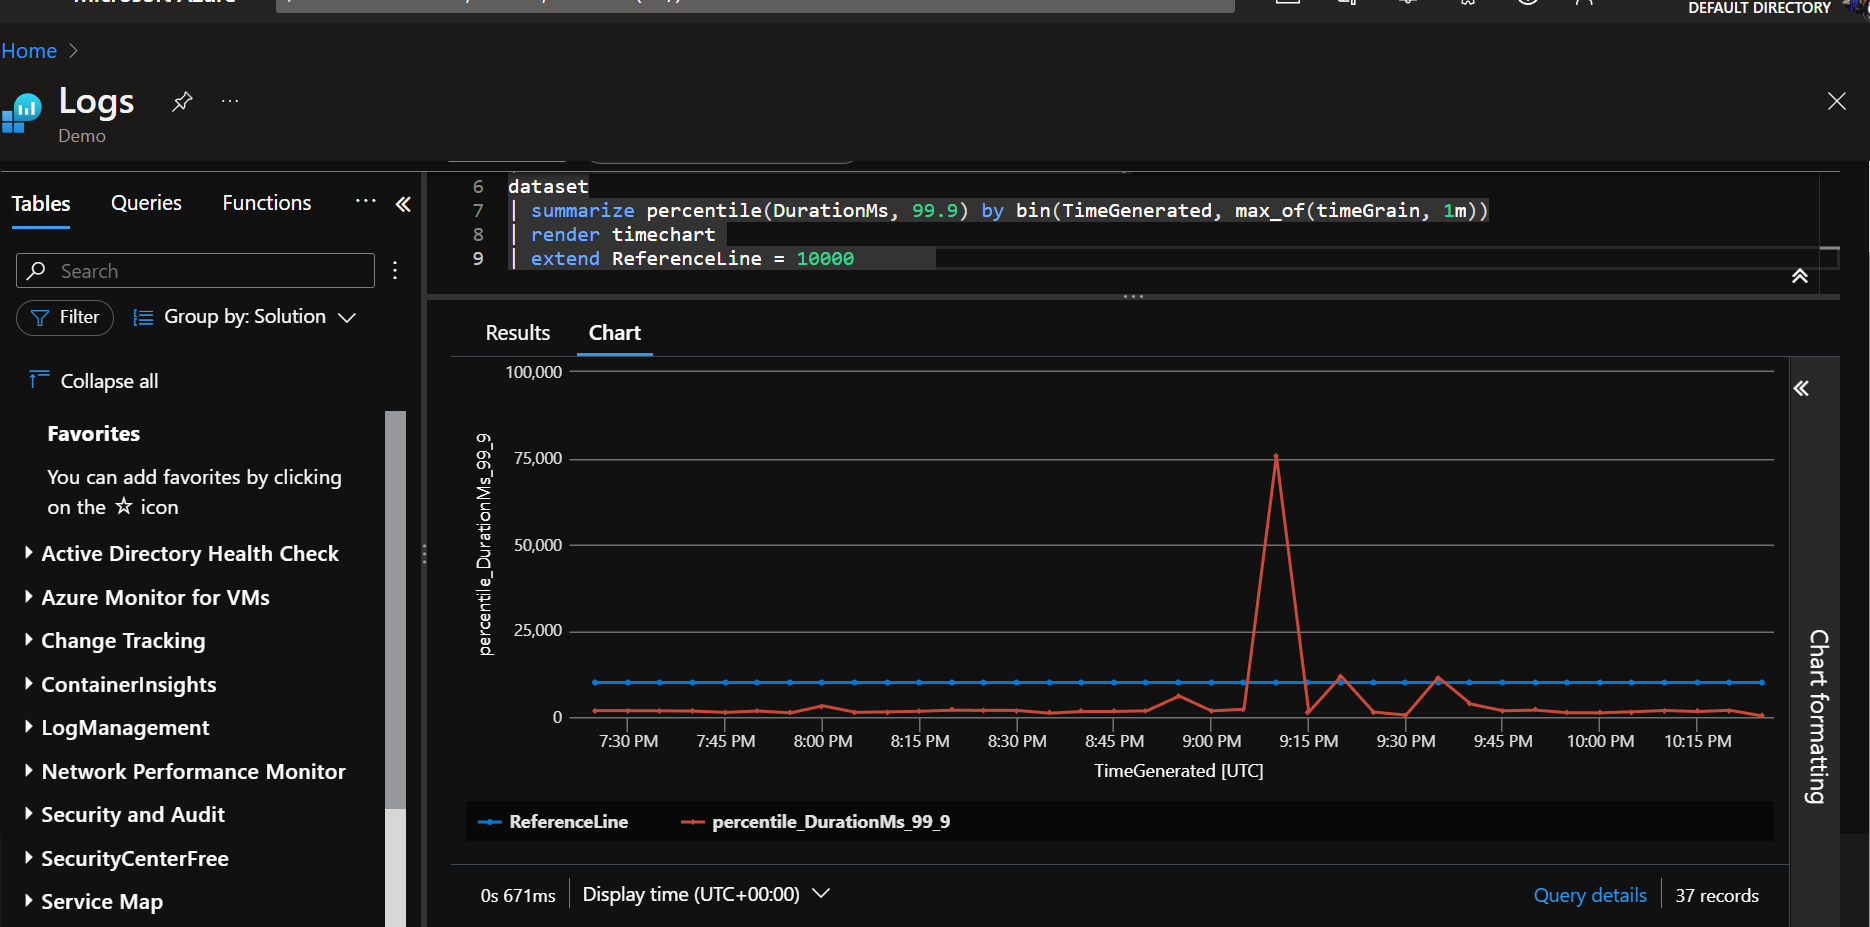
Latency
For a definition of latency, here is a explanation. So in this Kusto query it displays the latency, but also as an example notice the 'extend' key word to add the reference line (this would be in milliseconds). Useful if you guarantee your response time to be under a certain amount of time and if time has been breached.
let start = ago(3h);
let end = now();
let timeGrain=5m;
let dataset=AppRequests
| where TimeGenerated > start and TimeGenerated < end;
dataset
| summarize percentile(DurationMs, 99.9) by bin(TimeGenerated, max_of(timeGrain, 1m))
| render timechart
| extend ReferenceLine = 10000
In this example, if we were to take the reference seriously, we see three breaches, one big spike reaching 75,000 ms and two more just going above 10,000 ms.
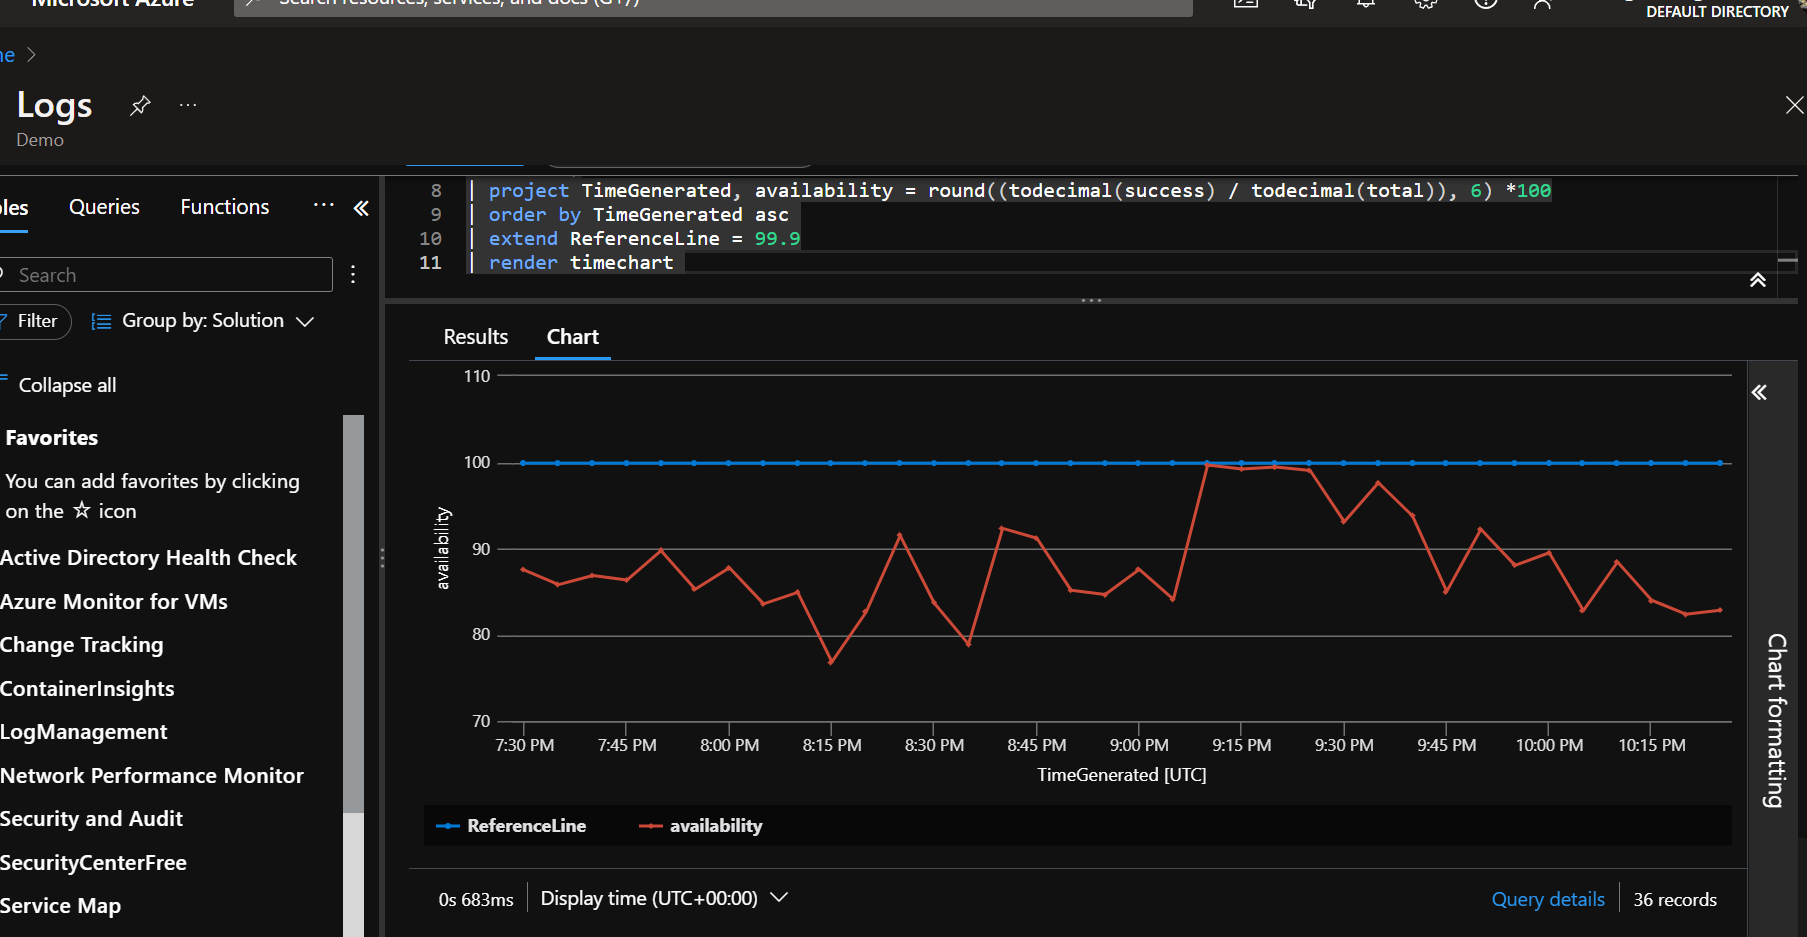
Availability
A definition for availability can be found here. In this example we are taking any result code under http status code 500 as a successful request.
let start = ago(3h);
let end = now();
let timeGrain=5m;
let dataset=AppRequests
| where TimeGenerated > start and TimeGenerated < end;
dataset
| summarize total = sum(ItemCount), success = sumif(ItemCount, toint(ResultCode) < 500) by bin(TimeGenerated, timeGrain)
| project TimeGenerated, availability = round((todecimal(success) / todecimal(total)), 6) *100
| order by TimeGenerated asc
| extend ReferenceLine = 99.9
| render timechart
In this example, this would probably be considered poor as the availability line is way under the reference line. As this is a test demo workspace, it's probably safe to say there are quite a few responses ending in a http status code 500 or higher. In a real world scenario, this would probably need a investigation as to why.
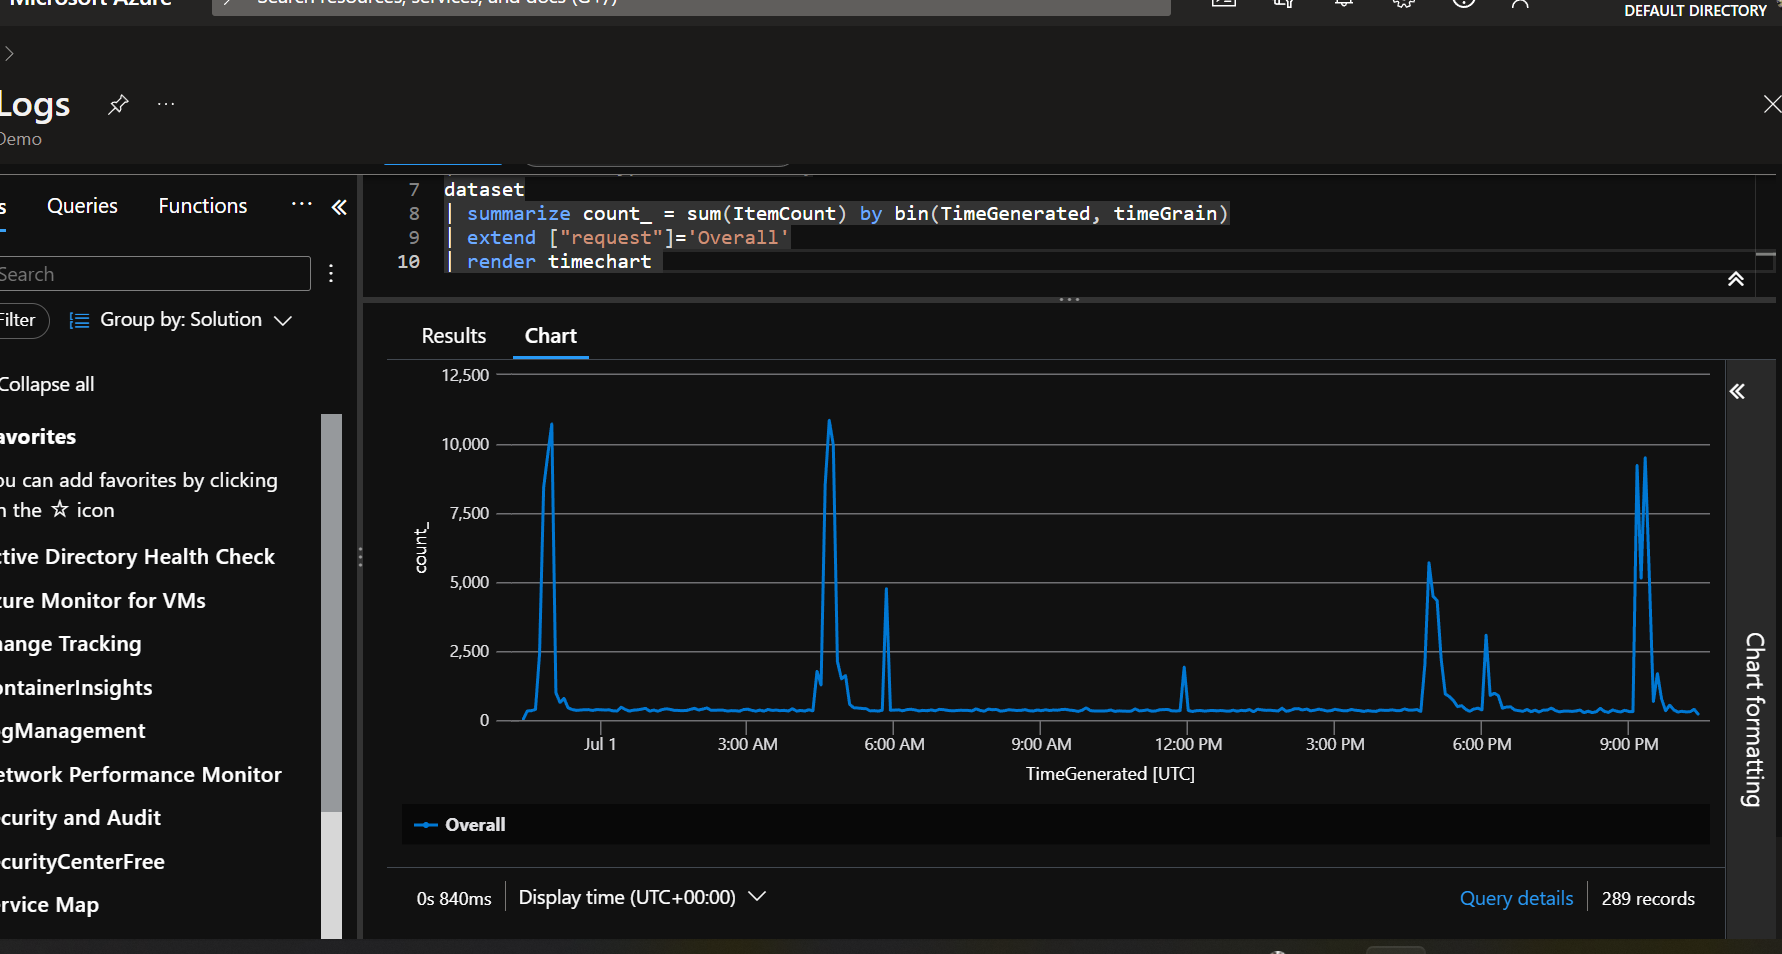
Count of all requests
This query will display overall request count for a day where the client was not a browser.
let start = ago(1d);
let end = now();
let timeGrain=5m;
let dataset=AppRequests
| where TimeGenerated > start and TimeGenerated < end
| where ClientType != "Browser";
dataset
| summarize count_ = sum(ItemCount) by bin(TimeGenerated, timeGrain)
| extend ["request"]='Overall'
| render timechart
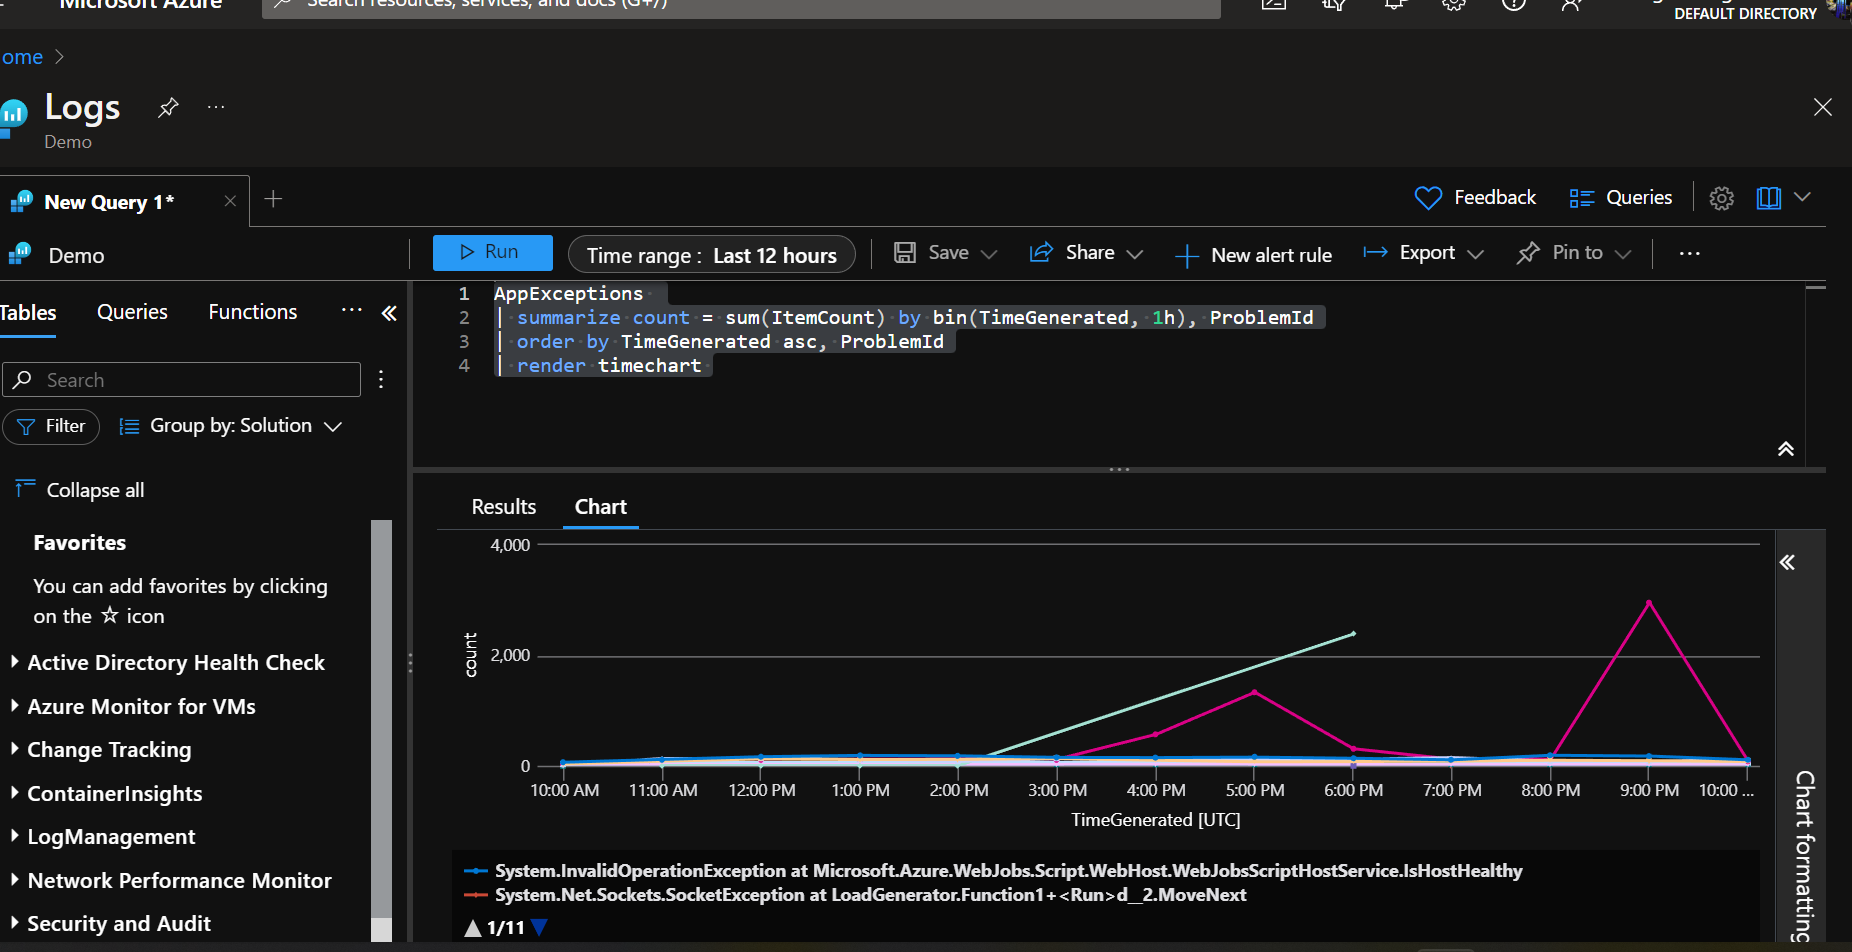
Exceptions
This query will give a breakdown of exceptions being thrown and show how the exception is performing over time.
AppExceptions
| summarize count = sum(ItemCount) by bin(TimeGenerated, 1h), ProblemId
| order by TimeGenerated asc, ProblemId
| render timechart
Syntax
let- let statementago(a_timespan)- ago() functionnow([offset])- now() functionT | where Predicate- where operator>,<,=,!=, etc - Numerical operatorsT | summarize [SummarizeParameters] [[Column =] Aggregation [, ...]] [by [Column =] GroupExpression [, ...]]- summarize operatorT | extend [ColumnName | (ColumnName[, ...]) =] Expression [, ...]- extend operatorT | order by column [asc | desc] [nulls first | nulls last] [, ...]- order operatorpercentile (Expr, Percentile)- percentile aggregation functionsum(Expr)- sum() aggregation functionsumif(Expr,Predicate)- sumif() aggregation functiontoint(Expr)- toint() functiontodecimal(Expr)- todecimal() functionround(source [, Precision])- round() functionbin(value,roundTo)- bin() functionT | project ColumnName [= Expression] [, ...]- project operatorT | render Visualization [with ( PropertyName = PropertyValue [, ...] )]- render operator
Useful links: